Contact between populations who speak different languages influences their speech in many ways, for example by borrowing words, or by borrowing intonation (the way the pitch of its speakers’ voices goes up and down as they speak, or the 'melody' of speech). Each language or dialect has its own 'melody'.
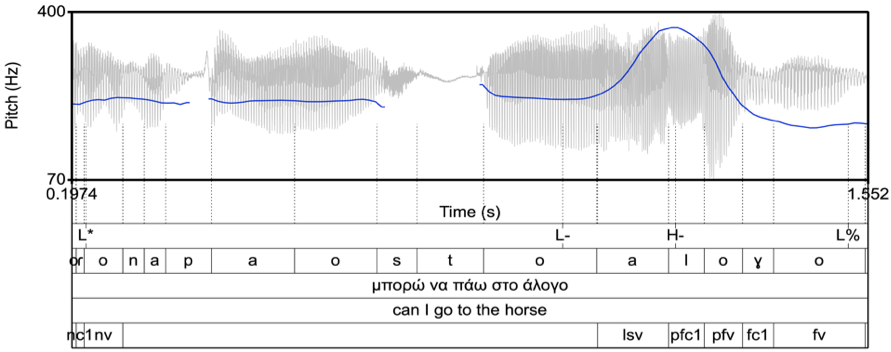
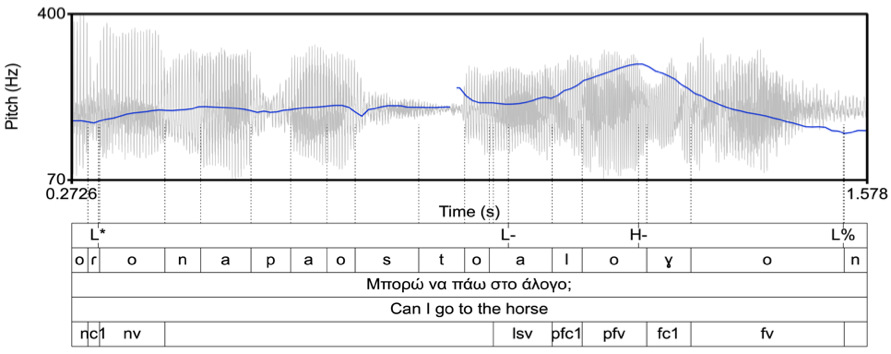
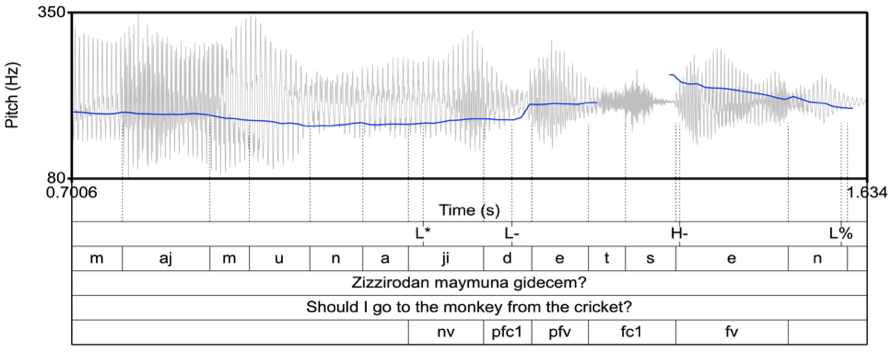
Below you can see three examples of what these changes in pitch look like in the intonation curves (the blue line in each example) of Athenian Greek (left), Cypriot Greek (middle), and Cypriot Turkish (right). The speakers in these examples are asking yes-no questions (also called 'polar questions'). We can see the same shape of pitch movement in all three languages: the voice remains low for the first two thirds of the question and then goes sharply up and sharply down during the final third of the question.
  |
 |
We attribute the similarity between the Athenian Greek and Cypriot Greek to their very close genetic relationship. On the other hand, there is no genetic relationship between Cypriot Greek and Cypriot Turkish: these languages belong to very distinct language families. In our project, we hypothesise that the intonational similarity between Cypriot Greek and Cypriot Turkish in yes-no questions has arisen because of close geographic contact between their speakers over many centuries.
To examine this hypothesis, we adopt an approach developed in the Phonetics Laboratory at the University of Oxford for the study of language history and change. This approach is based on the mathematical modelling of intonation curves in speech recordings which are carefully processed, and incorporates a general theory of intonation known as Autosegmental-Metrical Theory ('AM').
The bottom panels in each of the figures above illustrate the analysis of intonation using AM. The annotation in these panels (from top to bottom) shows the tones (L, H) in the AM analysis, the segmentation, orthographic annotation, translation and codification of stresses.
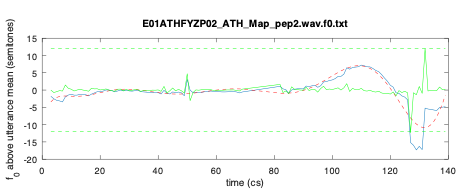
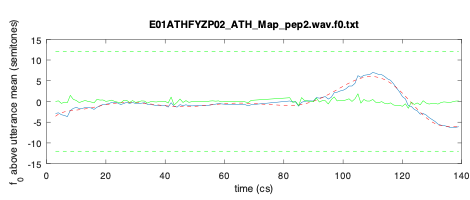
The two figures below give examples of one aspect of our speech processing method, involving f0 pitch tracking error correction. The panel on the left shows the detection of error, indicated by a spike in the difference signal (solid green line) reaching either of the two dashed green horizontal lines (showing a difference of ±12 semitones). The pitch track shows one octave jump error downwards at around 130 cs. The right panel shows the f0 curve after correction: The observed pitch track (blue line), the modelled curve fitted to the pitch track (red dashed curve) and the difference between observed data and polynomial model (solid green line), which after the correction does not show any jumps.
 |
 |
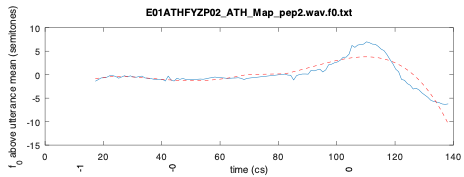
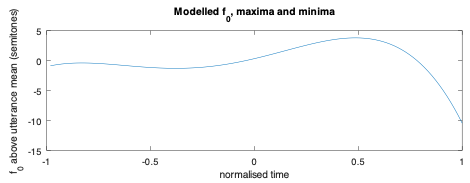
The final two figures show examples of the modelling of intonation curves. A fourth-order polynomial is fitted to the final part of an Athenian Greek yes-no question, which includes the f0 contour from the beginning of the nuclear vowel to the end of the question. The left panel shows the smooth modelled f0 curve (dashed line) superimposed over the observed data (continuous line). The right panel shows the same modelled curve with axes normalised to the interval [−1, 1].
 |
 |